AZOPTION Volatility Index Analysis 波幅指數分析
In Hong Kong, HSI Volatility Index (VHSI) is used as a measurement of the 30-day Expected Volatility of HSI.
With reference to the VHSI calculation methodology, we try to calculate similar Volatility Index for all the other Option Classes.
Due to the limitations of public data, the calculation is simplified, and we named it as "Simplified Volatility Index" (Code begins with "SV").
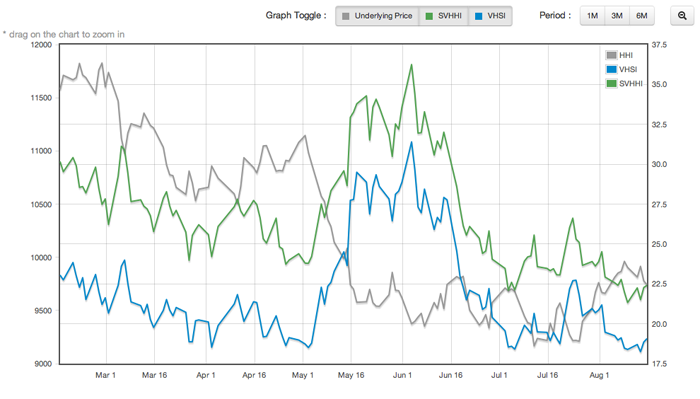
VHSI (Blue Line) vs SVHSI (Green Line) comparison : [LINK]
 Result: VHSI and SVHSI quite match with each others.

Other example: SVHHI (Simplified Volatility Index of HS China Enterprises Index) : [LINK]
 Result: HHI has similar movement as HSI, but with much higher volatility.

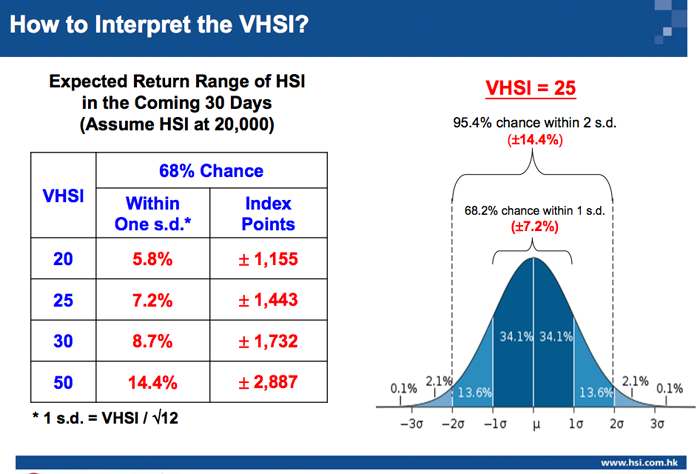
Base on the VHSI interpretation, we can find the "Expected Return Range of HSI in the Coming 30 Days" statistically :

(From www.hsi.com.hk)

(From www.hsi.com.hk)
Expected Return Range of HSI : [LINK]

The upper and lower blue line are the expected settlement range of the corresponding contract at the expiry date. (1 standard deviation)
You may change the number of standard deviation value to adjust the range tolerance.

The upper and lower blue line are the expected settlement range of the corresponding contract at the expiry date. (1 standard deviation)
You may change the number of standard deviation value to adjust the range tolerance.
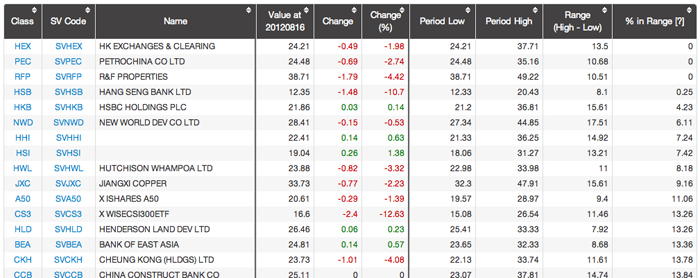
A list of Simplified Volatility Index allows you to check the volatility gainers and losers at a glance : [LINK]


Please note that these are only theoretical calculations and estimations, and the values are highly distorted in a thin volume market.
FOR YOUR REFERENCE ONLY!
FOR YOUR REFERENCE ONLY!