AZOPTION Performance Comparison Analysis 期權組合比較
You can compare both historical and future performance of your portfolios here.
Max. 5 portfolios can be compared at the same [Performance Chart].
If you have some target prices in future dates, you can key in into the [Comparison Table] (Max. 5 target price and date pairs).
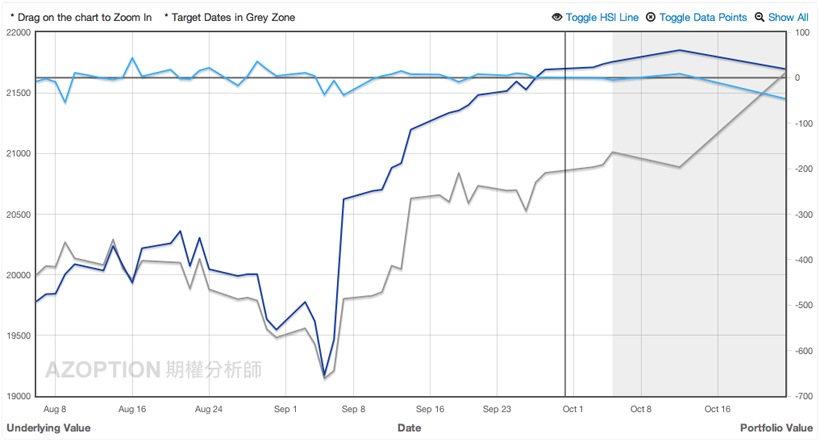
All your target prices and dates will be displayed in the grey zone at the right hand side of the chart.
A. Control Panel


B. Comparison Table


C. Performance Chart


A. Control Panel

- Underlying Class Name : Select the underlying class for this comparison.
- Underlying Price : The underlying market price as of the date.
- Get Full Link Button : The full url link containing all the settings of this comparison, bookmarking this link and return to your comparison without hassle.
- Refresh Chart Button : Manually refresh the chart if any parameters have been modified.
B. Comparison Table

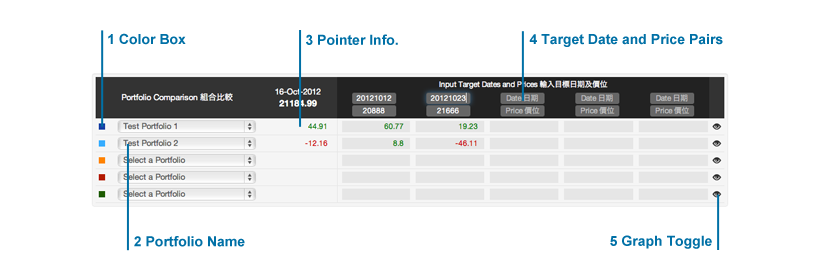
Comparison Table allows you to select max. 5 portfolios (With same underlying option class) for comparison.
- Color Box : Indicate the color of the graph in the [Comparison Table] representing this portfolio.
- Portfolio Name : Select the portfolio included in the comparison. Only portfolios with the same underlying class in [Option Class Name] with be listed.
- Pointer Info. : Showing the information where the pointer (Black vertical line in the [Performance Chart]) hovering.
- Target Date and Price Pairs : Input your forecasting price and date of the underlying, estimated values of all included portfolios will be displayed in the grey zone of the [Performance Chart].
- Graph Toggle : Show/Hide the graph.
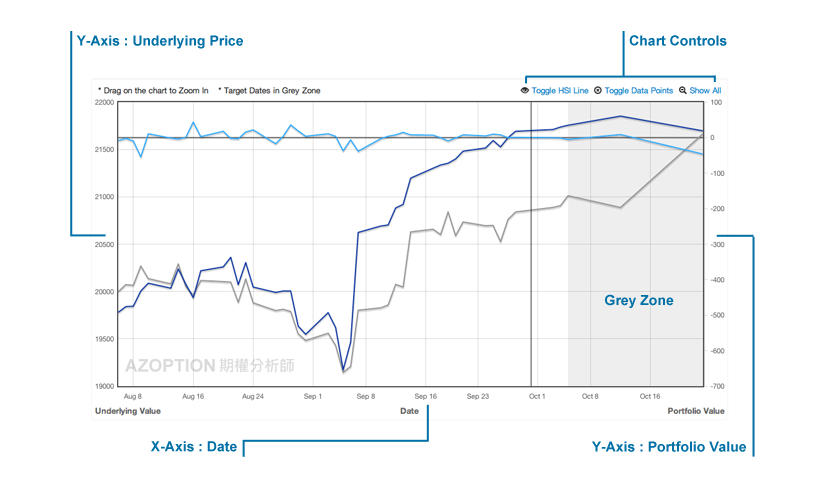
C. Performance Chart

- X-Axis : Date
- Y-Axis on the Left : Underlying Value
- Y-Axis on the Right : Portfolio Value
- Zoom In : Drag and highlight any chart area to zoom in.
- Chart Controls :
[Toggle Underlying Graph] : Show/Hide the underlying graph (Grey Line).
[Toggle Data Points] : Show/Hide value points on the graphs.
[Show All] : Display the whole chart. - Grey Zone : Only displayed when at least one of the target date and price pairs is provided. Showing the futures date values.