AZOPTION Range Analysis 近價期權分析
Range Analysis allows you to focus on a section of the option distribution.
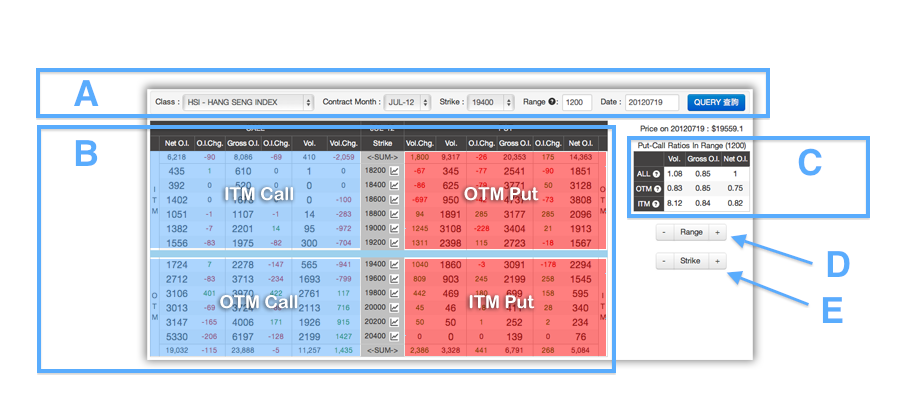
A. Control Panel
B. Option Distribution
C. Put/Call Ratios
D. Range Control
E. Strike Control
A. Control Panel
- Option basic informations: Class, Contract Month, Strike Price.
- Range: Select the strike price range for the analysis.
- Date: Option data as of this date
B. Option Distribution in Range
- Left Hand Side (LHS): Call Options (Blue in color)
- Right Hand Side (RHS): Put Options (Red in color)
- Blue Horizontal Line in the middle: Current Underlying Price or Strike Price selected in (A) Control Panel
- LHS Upper Area: In-The-Money (ITM) Call Options (Blue in color)
- LHS Lower Area: Out-Of-The-Money (OTM) Call Options (Blue in color)
- RHS Upper Area: Out-Of-The-Money (OTM) Put Options (Red in color)
- RHS Lower Area: In-The-Money (ITM) Put Options (Red in color)
C. Put/Call Ratios In Range
Calculate the P/C Ratios with different combinations of option values:
Columns:
Columns:
- "Vol.": Put/Call Ratios of the Option Volumes.
- "Gross O.I.": Put/Call Ratios of the Option Gross O.I.
- "Net O.I.": Put/Call Ratios of the Option Net O.I.
- "ALL": All Puts / All Calls (i.e. RHS/LHS)
- "OTM": All OTM Puts / All OTM Calls (i.e. Right Upper Corner/ Left Lower Corner)
- "ITM": All ITM Puts / All ITM Calls (i.e. Right Lower Corner/ Left Lower Corner)
D. Range Control
+/- buttons allow you to increase or decrease the range size.
E. Strike Control
+/- buttons allow you to move the current underlying line (blue line) to the next or previous strike price.